7. Polar Coordinates
Exercises
-
Convert the rectangular coordinates \((x,y)\) into polar coordinates \((r,\theta)\):
-
\((x,y)=(3,3)\)
The relations between rectangular coordinates \((x,y)\), the polar coordinates \((r,\theta)\) are \[\begin{array}{ll} x=r\cos\theta\qquad \qquad &r=\sqrt{x^2+y^2} \\ y=r\sin\theta&\tan\theta=\dfrac{y}{x} \end{array}\]
\((r,\theta)=\left(3\sqrt{2}, \dfrac{\pi}{4}\right)\)
Since the point is \((x,y)=(3,3)\) which is in the \(1^\text{st}\) quadrant, we have: \[\begin{aligned} r&=\sqrt{x^2+y^2}=\sqrt{9+9}=\sqrt{2\cdot9}=3\sqrt{2} \\ \theta&=\arctan\left(\dfrac{y}{x}\right) =\arctan\left(\dfrac{3}{3}\right) =\dfrac{\pi}{4} \end{aligned}\] So the point is: \[ (r,\theta)=\left(3\sqrt{2},\dfrac{\pi}{4}\right) \]
js
-
\((x,y)=(-2,-2\sqrt{3})\)
Be careful to check the quadrant.
\((r,\theta)=\left(4,\dfrac{4\pi}{3}\right)\)
Since the point is \((x,y)=(-2,-2\sqrt{3})\), we have: \[ r=\sqrt{x^2+y^2}=\sqrt{4+12}=4 \] Notice that \((x,y)=(-2,-2\sqrt{3})\) is in quadrant III. So to find \(\theta\), we add \(\pi\) radians to the \(\arctan\): \[\begin{aligned} \theta&=\arctan\left(\dfrac{y}{x}\right)+\pi =\arctan\left(\dfrac{-2\sqrt{3}}{-2}\right)+\pi\\ &=\dfrac{\pi}{3}+\pi=\dfrac{4\pi}{3} \end{aligned}\] So the point is: \[ (r,\theta)=\left(4,\dfrac{4\pi}{3}\right) \]
js
-
\((x,y)=(-2,5)\)
Be careful to check the quadrant.
\(\begin{aligned} (r,\theta)&=\left(\sqrt{29},\arctan\left(\dfrac{5}{-2}\right)+\pi\right) \\ &\approx(5.385,1.95\,\text{rad}) \approx(5.385,111.8^\circ) \end{aligned}\)
Since the point is \((x,y)=(-2,5)\), we have: \[\begin{aligned} r&=\sqrt{x^2+y^2}=\sqrt{4+25}=\sqrt{29} \\ &\approx5.385 \end{aligned}\] Notice that \((x,y)=(-2,5)\) is in quadrant II. So to find \(\theta\), we add \(\pi\) radians to the \(\arctan\): \[\begin{aligned} \theta&=\arctan\left(\dfrac{y}{x}\right)+\pi =\arctan\left(\dfrac{5}{-2}\right)+\pi\\ &\approx 1.95\,\text{rad} \end{aligned}\] In degrees we have: \[\begin{aligned} \theta&\approx1.95\,\text{rad} \times\dfrac{180^\circ}{\pi\,\text{rad}} \\ &\approx112^\circ \end{aligned}\] So the point is: \[\begin{aligned} (r,\theta)&=\left(\sqrt{29},\arctan\left(\dfrac{5}{-2}\right)+\pi\right) \\ &\approx(5.385,1.95\,\text{rad}) \approx(5.385,112^\circ) \end{aligned}\]
js
-
\((x,y)=\left(\dfrac{1}{2},\dfrac{\sqrt{3}}{2}\right)\)
\((r,\theta)=\left(1,\dfrac{\pi}{3}\right)\)
We compute: \[\begin{aligned} r&=\sqrt{x^2+y^2} =\sqrt{\left(\dfrac{1}{2}\right)^2+\left(\dfrac{\sqrt{3}}{2}\right)^2} \\ &=\sqrt{\dfrac{1}{4}+\dfrac{3}{4}}=1\\ \end{aligned}\] Since both \(x\) and \(y\) are both positive, we know that \(P\) is in quadrant \(I\) and thus we compute: \[\begin{aligned} \theta&=\arctan\left(\dfrac{\frac{\sqrt{3}}{2}}{\frac{1}{2}}\right) \\ &=\arctan(\sqrt{3}) \\ &=\dfrac{\pi}{3} \end{aligned}\] So the point is: \[ (r,\theta)=\left(1,\dfrac{\pi}{3}\right) \]
js
-
-
Convert the polar coordinates \((r,\theta)\) into rectangular coordinates \((x,y)\):
-
\((r,\theta)=\left(4,\dfrac{\pi}{3}\right)\)
The relations between rectangular coordinates \((x,y)\), the polar coordinates \((r,\theta)\) are \[\begin{array}{ll} x=r\cos\theta \qquad \qquad &r=\sqrt{x^2+y^2} \\ y=r\sin\theta&\tan\theta=\dfrac{y}{x} \end{array}\]
\((x,y)=(2,2\sqrt{3})\)
Using \(r=4\) and \(\theta=\dfrac{\pi}{3}\), we compute \[\begin{aligned} x&=r\cos\theta=4\cos\left(\dfrac{\pi}{3}\right) =4\cdot\dfrac{1}{2}=2 \\ y&=r\sin\theta=4\sin\left(\dfrac{\pi}{3}\right) =4\cdot\dfrac{\sqrt{3}}{2}=2\sqrt{3} \end{aligned}\] So the point is \((x,y)=(2,2\sqrt{3})\).
js
-
\((r,\theta)=\left(3,\dfrac{\pi}{2}\right)\)
What does \(\theta=\dfrac{\pi}{2}\) mean?
\((x,y)=(0,3)\)
Since \(\theta=\dfrac{\pi}{2}\), the point lies on the positive \(y\)-axis at a distance \(y=r=3\) from the origin. So the point is \((x,y)=(0,3)\). Of course the formulas would also work.
js
-
\((r,\theta)=\left(2,\dfrac{5\pi}{6}\right)\)
The transformation equations from polar \((r,\theta)\) to rectangular \((x,y)\), work in any quadrant. \[ x=r\cos\theta \qquad y=r\sin\theta \]
\((x,y)=(-\sqrt{3},1)\)
Using \(r=2\) and \(\theta=\dfrac{5\pi}{6}\), we compute \[\begin{aligned} x&=r\cos\theta=2\cos\left(\dfrac{5\pi}{6}\right) =2\cdot\dfrac{-\sqrt{3}}{2}=-\sqrt{3} \\ y&=r\sin\theta=2\sin\left(\dfrac{5\pi}{6}\right) =2\cdot\dfrac{1}{2}=1 \end{aligned}\] So the point is \((x,y)=(-\sqrt{3},1)\).
js
Notice that \(\theta=\dfrac{5\pi}{6}\) says the point is in quadrant II which agrees with the solution. The formulas work and there is nothing special to do for quadrants II and III.
Graph the following polar equations:
-
-
\(r=4+4\sin\theta\)
First graph a rectangular plot and use it to make the polar plot.
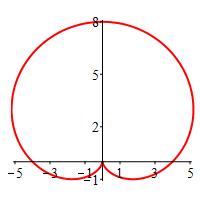
The rectangular plot is a sine curve stretched vertically by a factor of \(4\) and shifted up by \(4\). So it goes between \(0\) and \(8\).
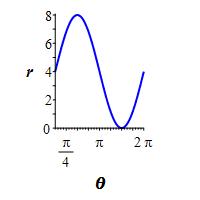
A table of important values is:
\(\theta=\) \(0\) \(\dfrac{\pi}{2}\) \(\pi\) \(\dfrac{3\pi}{2}\) \(2 \pi\) \(r=\) \(4\) \(8\) \(4\) \(0\) \(4\) So the polar plot starts at \(r=4\) when \(\theta=0\), goes up to \(r=8\) when \(\theta=\dfrac{\pi}{2}\), falls back to \(r=4\) when \(\theta=\pi\), falls to \(r=0\) when \(\theta=\dfrac{3\pi}{2}\), and finally closes back to \(r=4\) when \(\theta=2\pi\).
js
-
\(r=1+3\cos\theta\)
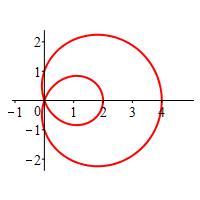
The rectangular plot is a cosine curve stretched vertically by a factor of \(3\) and shifted up by \(1\). So it goes between \(-2\) and \(4\).
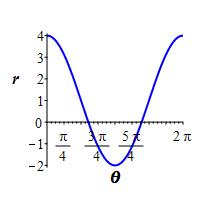
To find where the graph passes through the origin, we solve \(r=1+3\cos\theta=0\) to get \[ \theta=\arccos\left(\dfrac{-1}{3}\right) \approx.6\pi \] which is a little more than \(\dfrac{\pi}{2}\). A table of important values is:
\(\theta=\) \(0\) \(\dfrac{\pi}{2}\) \(.6\pi\) \(\pi\) \(1.4\pi\) \(\dfrac{3\pi}{2}\) \(2 \pi\) \(r=\) \(4\) \(1\) \(0\) \(-2\) \(0\) \(1\) \(4\) So the polar plot starts at \(r=4\) when \(\theta=0\), drops to \(r=1\) when \(\theta=\dfrac{\pi}{2}\) and to \(r=0\) when \(\theta=.6\pi\). Then it is negative which goes backwards until it reaches \(r=-2\) at \(\theta=\pi\). After that it is a mirror image.
js
-
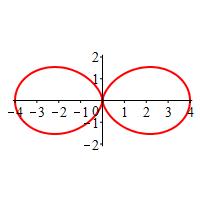
\(r=2\cos2\theta\)
The rectangular plot is a sine curve stretched vertically by a factor of \(2\) and compressed horizontally by a factor of \(2\).
To find where the graph passes through the origin, we solve \(r=2\cos2\theta=0\) to get \[ \theta=\dfrac{\pi}{4},\dfrac{3\pi}{4},\dfrac{5\pi}{4},\dfrac{7\pi}{4} \] A table of important values is:
\(\theta=\) \(0\) \(\dfrac{\pi}{4}\) \(\dfrac{\pi}{2}\) \(\dfrac{3\pi}{4}\) \(\pi\) \(\dfrac{5\pi}{4}\) \(\dfrac{3\pi}{2}\) \(\dfrac{7\pi}{4}\) \(2\pi\) \(r=\) \(2\) \(0\) \(-2\) \(0\) \(2\) \(0\) \(-2\) \(0\) \(2\) So the plot starts at \(r=2\) when \(\theta=0\), falls to \(r=0\) when \(\theta=\dfrac{\pi}{4}\), goes backwards to \(r=-2\) when \(\theta=\dfrac{\pi}{2}\), goes back to \(r=0\) when \(\theta=\dfrac{3\pi}{4}\), and continues this pattern until it closes back to \(r=2\) when \(\theta=2\pi\).
js
-
\(r=2+2\cos2\theta\)
The rectangular plot is a cosine curve stretched vertically by a factor of \(2\), compressed horizontally by a factor of \(2\), and shifted up by \(2\). So it goes between \(0\) and \(4\).
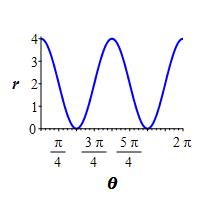
A table of important values is:
\(\theta=\) \(0\) \(\dfrac{\pi}{2}\) \(\pi\) \(\dfrac{3\pi}{2}\) \(2\pi\) \(r=\) \(4\) \(0\) \(4\) \(0\) \(4\) So the polar plot starts at \(r=4\) when \(\theta=0\), falls to \(r=0\) when \(\theta=\dfrac{\pi}{2}\), goes back up to \(r=4\) when \(\theta=\pi\), and has a mirror image back to \(\theta=2\pi\).
js
-
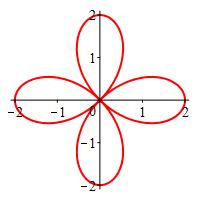
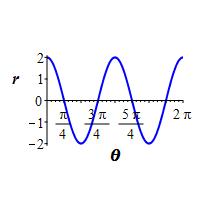
\(r=\sin4\theta\)
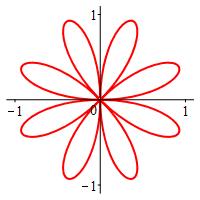
The rectangular plot is a sine curve compressed horizontally by a factor of \(4\).
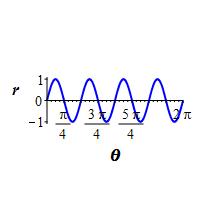
To find where the graph passes through the origin, we solve \(r=\sin4\theta=0\). The zeros occurs when \(4\theta=k\pi\). So: \[ \theta=\dfrac{k\pi}{4} \quad \text{for} \quad k=0,1,\cdot,8 \]
Looking at the rectangular plot, we see there will be a positive loop between \(0\) and \(\dfrac{\pi}{4}\) which reaches \(r=1\), then a negative loop between \(\dfrac{\pi}{4}\) and \(\dfrac{\pi}{2}\). These repeat \(3\) more times. It is important to notice that the negative loops never coincide with the positive loops. So we get an \(8\) leaf rose.
js
-
\(r=2\sin5\theta\)
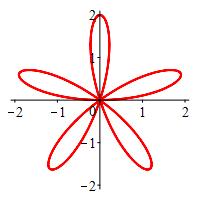
The rectangular plot is a sine curve compressed horizontally by a factor of \(5\) and stretched vertically by a factor of \(2\).
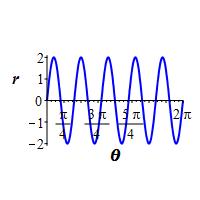
To find where the graph passes through the origin, we solve \(r=\sin5\theta=0\). The zeros occur when \(5\theta=k\pi\). So: \[ \theta=\dfrac{k\pi}{5} \quad \text{for} \quad k=0,1,\cdot,10 \]
Looking at the rectangular plot, we see there will be a positive loop between \(0\) and \(\dfrac{\pi}{5}\) which reaches \(r=2\), then a negative loop between \(\dfrac{\pi}{5}\) and \(\dfrac{2\pi}{5}\). These repeat \(4\) more times. This seems to say there should be \(10\) loops. However, looking at the polar plot, after \(\theta=\pi\) each loop overwrites one of the previous loops. For example, the loop between \(\pi\) and \(\dfrac{6\pi}{5}\) is negative and overwrites the positive loop between \(0\) and \(\dfrac{6\pi}{5}\). So we only get an \(5\) leaf rose.
js
-
Find the slope of the function \(r=2\cos\theta\)
for the following values of \(\theta\):
-
\(\theta=\dfrac{\pi}{6}\)
Given a polar function \(r(\theta)\), the slope of that function at a given value of \(\theta\) is \[ \dfrac{dy}{dx}=\dfrac{r'(\theta)\sin\theta+r(\theta)\cos\theta} {r'(\theta)\cos\theta-r(\theta)\sin\theta } \]
\(\dfrac{dy}{dx}=-\,\dfrac{1}{\sqrt{3}}\)
Given \(r(\theta)=2\cos\theta\), the derivative is \(r'=-2\sin\theta\). We have: \[\begin{aligned} \sin\left(\dfrac{\pi}{6}\right)&=\dfrac{1}{2} &\qquad \cos\left(\dfrac{\pi}{6}\right)&=\dfrac{\sqrt{3}}{2} \\[6pt] r\left(\dfrac{\pi}{6}\right)&=\sqrt{3} &\qquad r'\left(\dfrac{\pi}{6}\right)&=-1 \end{aligned}\] So: \[\begin{aligned} \left.\dfrac{dy}{dx}\right|_{\pi/6} &=\dfrac{r'(\theta)\sin\theta+r(\theta)\cos\theta} {r'(\theta)\cos\theta-r(\theta)\sin\theta }\\ &=\dfrac{-1\left(\dfrac{1}{2}\right)+\sqrt{3}\left(\dfrac{\sqrt{3}}{2}\right)} {-1\left(\dfrac{\sqrt{3}}{2}\right)-\sqrt{3}\left(\dfrac{1}{2}\right)} \\ &=\dfrac{-1+3}{-\sqrt{3}-\sqrt{3}} =-\,\dfrac{1}{\sqrt{3}} \end{aligned}\]
js
-
\(\theta=\dfrac{\pi}{4}\)
\(\dfrac{dy}{dx}=0\)
Given \(r(\theta)=2\cos\theta\), the derivative is \(r'=-2\sin\theta\). We have: \[\begin{aligned} \sin\left(\dfrac{\pi}{4}\right)&=\dfrac{1}{\sqrt{2}} &\qquad \cos\left(\dfrac{\pi}{4}\right)&=\dfrac{1}{\sqrt{2}} \\ r\left(\dfrac{\pi}{4}\right)&=\sqrt{2} &\qquad r'\left(\dfrac{\pi}{4}\right)&=-\sqrt{2} \end{aligned}\] So: \[\begin{aligned} \left.\dfrac{dy}{dx}\right|_{\pi/4}&=\dfrac{r'(\theta)\sin\theta+r(\theta)\cos\theta} {r'(\theta)\cos\theta-r(\theta)\sin\theta }\\ &=\dfrac{-\sqrt{2}\left(\dfrac{1}{\sqrt{2}}\right) +\sqrt{2}\left(\dfrac{1}{\sqrt{2}}\right)} {-\sqrt{2}\left(\dfrac{1}{\sqrt{2}}\right) -\sqrt{2}\left(\dfrac{1}{\sqrt{2}}\right)} \\ &=\dfrac{-1+1}{-1-1}=\dfrac{0}{-2}=0 \end{aligned}\]
js
-
\(\theta=\dfrac{13\pi}{6}\)
\(\dfrac{dy}{dx}=-\,\dfrac{1}{\sqrt{3}}\)
Given \(r(\theta)=2\cos\theta\), the derivative is \(r'=-2\sin\theta\). So: \[\begin{aligned} \sin\left(\dfrac{13\pi}{6}\right)&=\dfrac{1}{2} &\qquad \cos\left(\dfrac{13\pi}{6}\right)&=\dfrac{\sqrt{3}}{2} \\[6pt] r\left(\dfrac{13\pi}{6}\right)&=\sqrt{3} &\qquad r'\left(\dfrac{13\pi}{6}\right)&=-1 \end{aligned}\] So: \[\begin{aligned} \left.\dfrac{dy}{dx}\right|_{13\pi/6} &=\dfrac{r'(\theta)\sin\theta+r(\theta)\cos\theta} {r'(\theta)\cos\theta-r(\theta)\sin\theta }\\ &=\dfrac{-1\left(\dfrac{1}{2}\right)+\sqrt{3}\left(\dfrac{\sqrt{3}}{2}\right)} {-1\left(\dfrac{\sqrt{3}}{2}\right)-\sqrt{3}\left(\dfrac{1}{2}\right)} \\ &=\dfrac{-1+3}{-\sqrt{3}-\sqrt{3}} =-\,\dfrac{1}{\sqrt{3}} \end{aligned}\]
js
The fact that parts (a) and (c) have the same answer should be no suprise! The period of \(2\cos\theta\) is \(2\pi\). So \(\theta=\dfrac{13\pi}{6}=2\pi+\dfrac{\pi}{6}\) gives the same answer as \(\theta=\dfrac{\pi}{6}\).
-
-
Find the slope of the function \(r=1+2\sin\theta\)
for the following values of \(\theta\):
-
\(\theta=-\,\dfrac{\pi}{4}\)
Given a polar function \(r(\theta)\), the slope of that function at a given value of \(\theta\) is \[ \dfrac{dy}{dx}=\dfrac{r'(\theta)\sin\theta+r(\theta)\cos\theta} {r'(\theta)\cos\theta-r(\theta)\sin\theta } \]
\(\dfrac{dy}{dx}=1-2\sqrt{2}\)
Given \(r(\theta)=1+2\sin\theta\), the derivative is \(r'=2\cos\theta\). We know: \[\begin{aligned} \sin\left(-\,\dfrac{\pi}{4}\right)&=-\,\dfrac{1}{\sqrt{2}} &\qquad \cos\left(-\,\dfrac{\pi}{4}\right)&=\dfrac{1}{\sqrt{2}} \\ r\left(-\,\dfrac{\pi}{4}\right)&=1-\sqrt{2} &\qquad r'\left(-\,\dfrac{\pi}{4}\right)&=\sqrt{2} \end{aligned}\] So: \[\begin{aligned} \left.\dfrac{dy}{dx}\right|_{-\pi/4}&=\dfrac{r'(\theta)\sin\theta+r(\theta)\cos\theta} {r'(\theta)\cos\theta-r(\theta)\sin\theta }\\ &=\dfrac{\sqrt{2}\left(-\,\dfrac{1}{\sqrt{2}}\right) +(1-\sqrt{2})\left(\dfrac{1}{\sqrt{2}}\right)} {\sqrt{2}\left(\dfrac{1}{\sqrt{2}}\right) -(1-\sqrt{2})\left(-\,\dfrac{1}{\sqrt{2}}\right)} \\ &=\dfrac{-1+\dfrac{1}{\sqrt{2}}-1} {1+\dfrac{1}{\sqrt{2}}-1} \\ &=\dfrac{\dfrac{1}{\sqrt{2}}-2}{\dfrac{1}{\sqrt{2}}}=1-2\sqrt{2} \end{aligned}\]
js
-
\(\theta=\dfrac{11\pi}{6}\)
\(\dfrac{dy}{dx}=-\,\dfrac{1}{\sqrt{3}}\)
Given \(r(\theta)=1+2\sin\theta\), the derivative is \(r'=2\cos\theta\). We have: \[\begin{aligned} \sin\left(\dfrac{11\pi}{6}\right)&=-\,\dfrac{1}{2} &\qquad \cos\left(\dfrac{11\pi}{6}\right)&=\dfrac{\sqrt{3}}{2} \\[6pt] r\left(\dfrac{11\pi}{6}\right)&=0 &\qquad r'\left(\dfrac{11\pi}{6}\right)&=\sqrt{3} \end{aligned}\] So: \[\begin{aligned} \left.\dfrac{dy}{dx}\right|_{11\pi/6} &=\dfrac{r'(\theta)\sin\theta+r(\theta)\cos\theta} {r'(\theta)\cos\theta-r(\theta)\sin\theta }\\ &=\dfrac{\sqrt{3} \left(-\,\dfrac{1}{2} \right) +(0)\left(\dfrac{\sqrt{3}}{2}\right)} {\sqrt{3}\left(\dfrac{\sqrt{3}}{2}\right) -(0)\left(-\,\dfrac{1}{2}\right)} \\ &=\dfrac{-\sqrt{3}}{3} =-\,\dfrac{1}{\sqrt{3}} \end{aligned}\]
This is a special case where \(r(\theta)=0\). So the formula reduces to: \[\begin{aligned} \dfrac{dy}{dx} &=\dfrac{r'(\theta)\sin\theta+r(\theta)\cos\theta} {r'(\theta)\cos\theta-r(\theta)\sin\theta} \\ &=\dfrac{\sin\theta}{\cos\theta}=\tan\theta \end{aligned}\] and \(\dfrac{dy}{dx}=\tan\left(\dfrac{11\pi}{6}\right) =-\,\dfrac{1}{\sqrt{3}}\).
js
-
\(\theta=\pi\)
\(\dfrac{dy}{dx}=-\,\dfrac{1}{2}\)
Given \(r(\theta)=1+2\sin\theta\), the derivative is \(r'=2\cos\theta\). We have: \[\begin{aligned} \sin(\pi)&=0 &\qquad \cos(\pi)&=-1 \\ r(\pi)&=1 &\qquad r'(\pi)&=-2 \end{aligned}\] So: \[\begin{aligned} \left.\dfrac{dy}{dx}\right|_\pi &=\dfrac{r'(\theta)\sin\theta+r(\theta)\cos\theta} {r'(\theta)\cos\theta-r(\theta)\sin\theta }\\ &=\dfrac{-2(0) +1(-1)} {-2(-1) -1(0)} =-\,\dfrac{1}{2} \end{aligned}\]
js
-
-
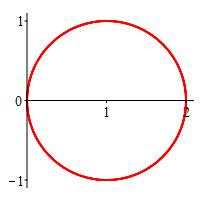
\(r=2\cos\theta\)
The area of a polar region bounded by the function \(r(\theta)\) and spanning from \(\theta=\alpha\) to \(\theta=\beta\) is \[ A=\int_\alpha^\beta \dfrac{1}{2}(r(\theta))^2\,d\theta \]
\(A=\pi\)
Looking at the plot, we see we need to integrate between \(\theta=-\,\dfrac{\pi}{2}\) and \(\theta=\dfrac{\pi}{2}\).
We thus compute:
\[\begin{aligned} A&=\int_\alpha^\beta \dfrac{1}{2}(r(\theta))^2\,d\theta \\ &=\int_0^\pi \dfrac{1}{2}(2\cos\theta)^2\,d\theta \\ &=2\int_0^\pi \cos^2\theta\,d\theta \\ \end{aligned}\]We then apply the trig identity \(\cos^2\theta=\dfrac{1+\cos2\theta}{2}\):
\[\begin{aligned} A&=2\int_0^\pi \dfrac{1+\cos2\theta}{2}\,d\theta \\ &=\left[\theta+\dfrac{\sin2\theta}{2} \right]_0^\pi \\ &=(\pi+0)-(0+0) \\ &=\pi \end{aligned}\]js
Without doing any calculus, we should have know the answer immediately as \(r=2\cos\theta\) is a circle centered at \((1,0)\) with radius \(1\).
-
One leaf of the rose \(r=3\sin2\theta\).
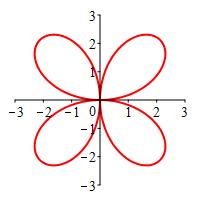
\(A=\dfrac{9\pi}{8}\)
Looking at the plot, we see this is a \(4\)-leaf rose. The radius goes to \(0\) when \(2\theta=k\pi\) or \(\theta=k\dfrac{\pi}{2}\). We can pick any leaf but the obvious one is \(0 \le \theta \le \dfrac{\pi}{2}\).
We thus compute: \[\begin{aligned} A&=\int_\alpha^\beta \dfrac{1}{2}(r(\theta))^2\,d\theta \\ &=\int_0^{\pi/2} \dfrac{1}{2}(3\sin2\theta)^2\,d\theta \\ &=\dfrac{9}{2}\int_0^{\pi/2} \sin^2 2\theta\,d\theta \\ \end{aligned}\]
We then apply the trig identity \(\sin^2\theta=\dfrac{1-\cos2\theta}{2}\): \[\begin{aligned} A&=\dfrac{9}{4}\int_0^{\pi/2} 1-\cos4\theta\,d\theta \\ &=\dfrac{9}{4}\left[\theta-\dfrac{\sin4\theta}{4} \right]_0^{\pi/2} \\ &=\dfrac{9}{4}\left[\left(\dfrac{\pi}{2}+0\right)-(0+0)\right] \\ &=\dfrac{9\pi}{8} \end{aligned}\]
js
-
One petal of the flower \(r=2+2\sin3\theta\).
You first need to find when \(r=0\).
\(A=2\pi\)
We first need to know when \(r=0\). So we solve: \[\begin{aligned} r=2+2\sin3\theta&=0 \\ 2\sin3\theta&=-2 \\ \sin3\theta&=-1 \\ 3\theta&=-\,\dfrac{\pi}{2}+2\pi k \\ \theta&=-\,\dfrac{\pi}{6}+\dfrac{2\pi}{3} k \\ \theta&=\dfrac{-\pi+4\pi k}{6} \\ \end{aligned}\]
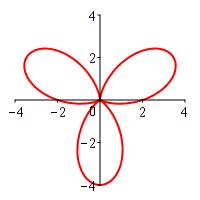
For \(0 \le \theta \le 2\pi\) this gives us \(r=0\) when \(\theta=\dfrac{\pi}{2},\dfrac{7\pi}{6},\dfrac{11\pi}{6}\). We take \(2\) consecutive values of \(\theta\) as our interval of integration and compute: \[\begin{aligned} A&=\int_{\pi/2}^{7\pi/6} \dfrac{1}{2}(r(\theta))^2\,d\theta \\ &=\int_{\pi/2}^{7\pi/6} \dfrac{1}{2}(2+2\sin3\theta)^2\,d\theta \\ &=\dfrac{1}{2}\int_{\pi/2}^{7\pi/6} 4+8\sin3\theta+4\sin^2 3\theta \,d\theta \\ &=\int_{\pi/2}^{7\pi/6} 2+4\sin3\theta+2\sin^2 3\theta \,d\theta \\ \end{aligned}\] We then apply the trig identity \(\sin^2\theta=\dfrac{1-\cos2\theta}{2}\): \[\begin{aligned} A&=\int_{\pi/2}^{7\pi/6} 2+4\sin3\theta+(1-\cos6\theta)\,d\theta \\ &=\int_{\pi/2}^{7\pi/6} 3+4\sin3\theta -\cos6\theta \,d\theta \\ &=\left[3\theta -\dfrac{4}{3}\cos3\theta -\dfrac{1}{6}\sin6\theta \right]_{\pi/2}^{7\pi/6} \\ &=\left[(\dfrac{7\pi}{2}-0-0)-(\dfrac{3\pi}{2}-0-0)\right]\\ &=\dfrac{4\pi}{2}=2\pi \end{aligned}\]
js
-
\(r=\cos\theta+\sin\theta\) over the inteval \([0,\pi]\)
The arc length of a polar curve \(r=r(\theta)\) from \(\theta=\alpha\) to \(\theta=\beta\) is \[ L=\int_\alpha^\beta \sqrt{\,r(\theta)^2+\left(\dfrac{dr}{d\theta}\right)^2}\,d\theta \]
\(L=\sqrt{2}\,\pi\)
We compute \[\begin{aligned} L&=\int_\alpha^\beta \sqrt{ r(\theta)^2+\left(\dfrac{dr}{d\theta}\right)^2 }\,d\theta \\ &=\int_0^\pi \sqrt{(\cos\theta+\sin\theta)^2 +(-\sin\theta+\cos\theta)^2}\,d\theta \\ &=\int_0^\pi \sqrt{ (\cos^2\theta+2\cos\theta\sin\theta+\sin^2\theta) +(\sin^2\theta-2\sin\theta\cos\theta+\cos^2\theta)}\,d\theta \\ &=\int_0^\pi \sqrt{2\cos^2\theta+2\sin^2\theta}\,d\theta \\ &=\int_0^\pi \sqrt{2}\,d\theta =\left.\sqrt{2}\,\theta\rule{0pt}{10pt}\right|_0^\pi =\sqrt{2}\,\pi \end{aligned}\]
js
-
\(r=\sin^2\dfrac{\theta}{2}\) over the interval \([0,\pi]\)
\(L=2\)
We compute \[\begin{aligned} L&=\int_\alpha^\beta \sqrt{ r(\theta)^2+\left(\dfrac{dr}{d\theta}\right)^2}\,d\theta \\ &=\int_0^\pi \sqrt{ \left(\sin^2\left(\dfrac{\theta}{2}\right)\right)^2 +\left(\sin\left(\dfrac{\theta}{2}\right)\cos\left(\dfrac{\theta}{2}\right)\right)^2 }\,d\theta \\ &=\int_0^\pi \sqrt{ \sin^4\left(\dfrac{\theta}{2}\right) +\sin^2\left(\dfrac{\theta}{2}\right)\cos^2\left(\dfrac{\theta}{2}\right) }\,d\theta \\ &=\int_0^\pi \sqrt{ \sin^2\left(\dfrac{\theta}{2}\right) \left( \sin^2\left(\dfrac{\theta}{2}\right)+\cos^2\left(\dfrac{\theta}{2}\right) \right) }\,d\theta \\ &=\int_0^\pi \sqrt{ \sin^2\left(\dfrac{\theta}{2}\right) }\,d\theta \\ &=\int_0^\pi \left|\sin\left(\dfrac{\theta}{2}\right)\right| \,d\theta \end{aligned}\] Since \(\sin\left(\dfrac{\theta}{2}\right) \ge 0\) on the interval \([0,\pi]\), we can get rid of the absolute value: \[\begin{aligned} L&=\int_0^\pi \sin\left(\dfrac{\theta}{2}\right)\,d\theta \\ &=\left[-2\cos\left(\dfrac{\theta}{2}\right)\right]_0^\pi \\ &=[-2(0)-(-2(1))] =2 \end{aligned}\]
js
-
\(r=\sec\theta\) over the interval \(\left[-\,\dfrac{\pi}{4},\dfrac{\pi}{4}\right]\)
\(L=2\)
We compute: \[\begin{aligned} L&=\int_\alpha^\beta \sqrt{r(\theta)^2+\left(\dfrac{dr}{d\theta}\right)^2}\,d\theta \\ &=\int_{-\pi/4}^{\pi/4} \sqrt{(\sec\theta)^2+(\sec\theta\tan\theta)^2}\,d\theta \\ &=\int_{-\pi/4}^{\pi/4} \sqrt{\sec^2\theta+\sec^2\theta\tan^2\theta}\,d\theta \\ &=\int_{-\pi/4}^{\pi/4} \sqrt{\sec^2\theta(1+\tan^2\theta)}\,d\theta \\ &=\int_{-\pi/4}^{\pi/4} \sqrt{\sec^4\theta}\,d\theta =\int_{-\pi/4}^{\pi/4} \sec^2\theta\,d\theta \\ &=\left.\tan\theta\rule{0pt}{10pt}\right|_{-\pi/4}^{\pi/4} =1-(-1)=2 \end{aligned}\]
js
Find the area enclosed by each curve:
Find the arc length of each curve on the indicated interval.
Heading
Placeholder text: Lorem ipsum Lorem ipsum Lorem ipsum Lorem ipsum Lorem ipsum Lorem ipsum Lorem ipsum Lorem ipsum Lorem ipsum Lorem ipsum Lorem ipsum Lorem ipsum Lorem ipsum Lorem ipsum Lorem ipsum Lorem ipsum Lorem ipsum Lorem ipsum Lorem ipsum Lorem ipsum Lorem ipsum Lorem ipsum Lorem ipsum Lorem ipsum Lorem ipsum